Overview
Drush offers a few commands that can help you troubleshoot your Drupal site when things go wrong.
Displaying Drush and Drupal information
Use the core:status command to learn more about your environment and current Drupal installation, if any:
- Database connection settings
- PHP-related settings
- Drush-related settings
- Drupal-related settings
If your site is unreachable via the browser, running core:status can help you determine if Drupal is installed and/or if you have specified the correct database credentials or other configuration settings.
Example
drush core:status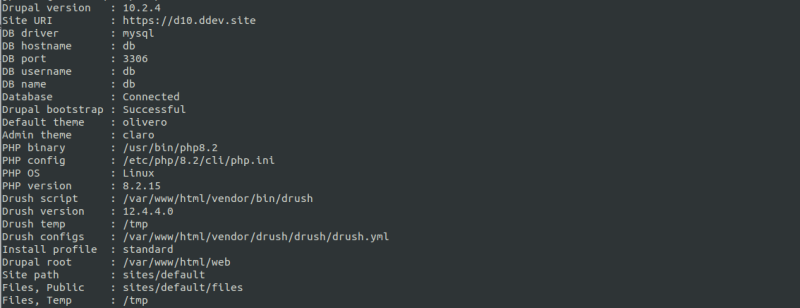
Enabling verbose Drush output
Many Linux commands, Drush included, provide one or more command-line options to increase the command's verbosity - the amount of information it displays as part of its output.
The command-line options -v, -vv, and -vvv are available for all Drush commands, and each one increases the verbosity more than the previous one.
The -vvv option is the most verbose one, and also shows debug notices.
Using these verbosity options can help clarify what may be going wrong if Drush is not doing what it is supposed to do.
Activity
Find out which other commands are available in the "core" namespace.
Displaying error log entries
Drupal's built-in logging system called Watchdog contains log messages of various severity levels, created by a Core subsystem or by custom / contributed modules.
Show the latest messages with watchdog:show
Use watchdog:show to show the latest messages.
Interesting options
--count: number of messages to show-- severity: only show messages with the specified severity level--type: only show messages of the given type (*)
(*) Message type refers to which part of Drupal or which module was responsible for creating the log message.
Example
drush watchdog:show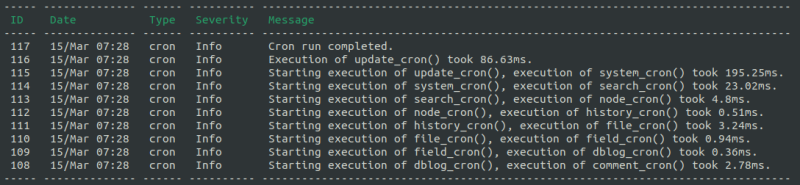
Example: showing more messages
drush watchdog:show --count=20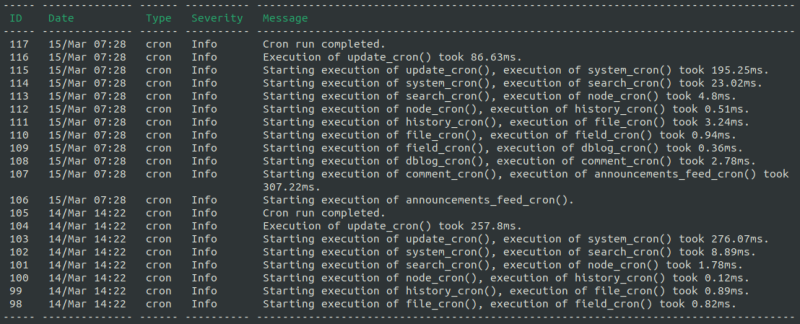
Show a single message with watchdog:show-one
Use watchdog:show-one [message id] to show the latest messages.
Example
drush watchdog:show 117
Show messages as they are added to the log
The Linux command-line utility tail shows the last lines of any file - typically used for log files. It can also keep the file open in the terminal so you can see new lines being added in real time.
The Drush command watchdog:tail shows the last 10 messages and waits for new messages to come in, and then displays those.
Use CTRL+C to return to the command-line.
Activity
What command do you need to run to see the 50 last messages created by "system", with severity "info"?
drush watchdog:show --count=50 --type=system --severity=InfoActivity
Use the watchdog:tail command and compare it with the watchdog:show command. What is the difference?
They produce the same output, but watchdog:show returns to the command line, and watchdog:tail waits for new messages to come in.
Activity
Find out what other commands are available in the "watchdog" namespace.
Activity
Experiment with watchdog:list.
What's the difference with watchdog:show?
Watchdog:showshows a non-interactive list of messages. You need to provide one or more options to filter the list.Watchdog:listfirst lets you select a severity or type interactively before showing the filtered list.
Summary
- Use
core:statusto show info about Drush and Drupal. - Use
-v,-vv, or-vvvto increase output verbosity. - Use
watchdog:showto show the last log messages. - Use
watchdog:showto interactively filter the last log messages. - Use
watchdog:show-oneto show a single message in detail. - Use
watchdog:tailto keep a terminal window open with an automatically updating list of messages.